

 Dizkover
How to Use Technical Analysis When You Trade #Bitcoin? #BTC
Updated March 29, 2018 ● 1,870 views
About Cryptocurrency Channel
Everything about the world of cryptocurrency such ass Bitcoin, Litecoin, Ether, Ripple, and more.
Just like a regular stock, cryptocurrency can be traded using technical analysis. Professional traders use this but a lot of regular traders doesn't know that there are certain patterns that big traders follow before they buy and sell their coins.
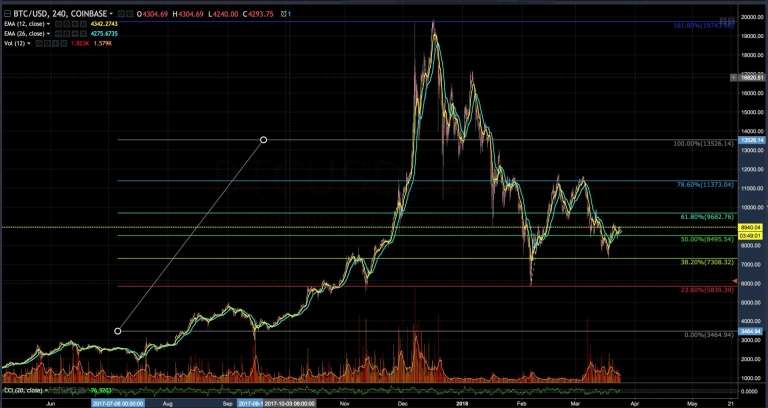
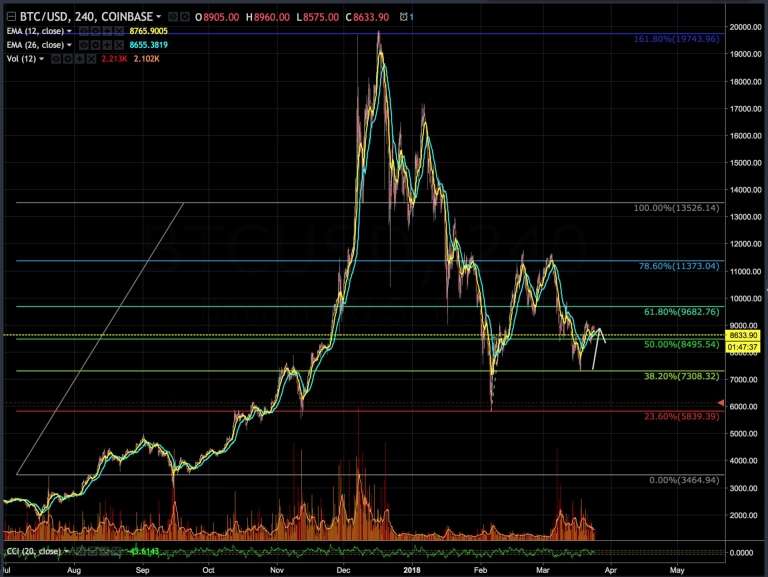
Let's look at Bitcoin's (BTC) 4-hour chart. Remember, there are several exchanges such as GDAX (Coinbase), Binance, and Bitfinex so there will be some differences with regards to price. The one I'm showing you now is from GDAX which is owned by Coinbase.
There's a lot of studies and indicators when we talk about technical analysis. In my opinion, a lot of it are just a waste of time. But there are some charting tools that would certainly give you the edge if you know how to use it in the chart.
Buying Low and Selling High
The only way you're going to win trades is when you buy low and sell high. You're not going to make money by just hodling. You will only make money when you cash out. Now, how are you going to know when the coin price is low or when it is high? We know this by looking at the chart. Now, this is not 100% accurate. But knowing how to do the chart will give you a high probability of getting it right.
Using Fibonacci Retracement
Fibonacci Retracement will help you identify price levels in the chart. This tool is one of the basic tools in a charting program. I use Tradingview.com to chart my cryptocurrency trades.
Using Fibonacci Retracement, you can identify the price levels of a stock or your coin. This is also what you call the Support and Resistance levels. In this example, we are looking at BTC support and resistance levels in the 4-hour chart. You will see in this chart that the price bounces off the support and resistance levels.
What is Support and Resistance?
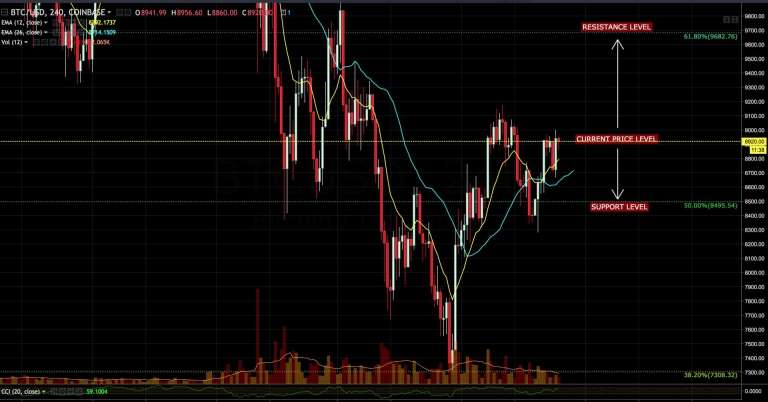
Support and Resistance are price levels where the price of a stock (coin) typically bounces off. In this example, the support is the price level below the current price. It's called support because the assumption is it will support the current price from falling below that price level.
The resistance is the price level above the current price. It's called resistance because the assumption is the price will drop when it reaches that price level.
Why Do Price Bounces Off Support and Resistance Levels?
The price typically bounces of support and resistance due to self-fulfilling prophecy. It just means, many professional traders are looking at these levels and are trading based on this information.
For example, if BTC price is about to reach a resistance level, many traders will sell when it happens or even before it happens. Therefore, the price of BTC drops, unless big orders come in to push the price above the resistance. When this happens, it's what you call a breakout. I'm not going to talk about breakout here. But that's another event you can watch to profit from a trade.
The same scenario occurs when the price is about to reach the support level. Traders buy that's why you see the price eventually go higher.
This is why the price of BTC bounces off the support and resistance levels.
When Do You Buy and When Do You Sell Bitcoin?
By knowing these support and resistance levels from the Fibonacci chart, you can make an educated guess if a price is about to go high by bouncing off from support level or if the price is about to drop by bouncing off the resistance level.
You buy BTC when the price is close to falling to the support price level. You sell BTC when the price is about to reach the resistance level. That's how you buy low and sell high.
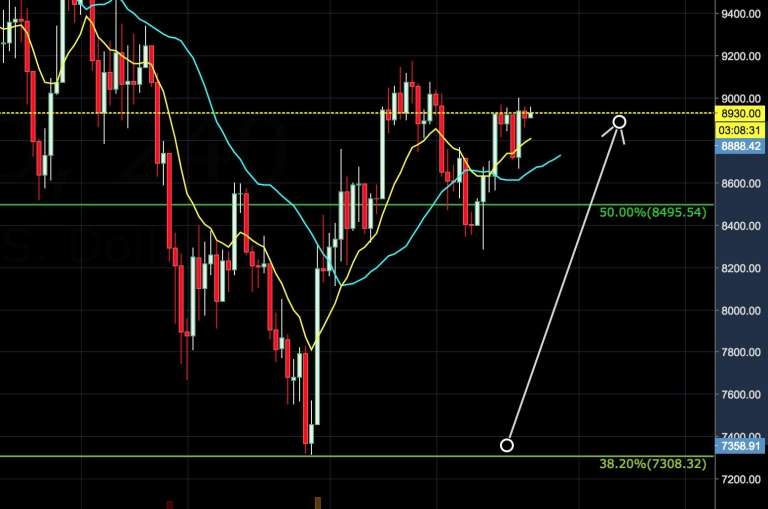
A very good example just recently is when the price of BTC fell close to $7300 support level then it bounced back to $9000+. If you have this chart, you would have made over 20% profit. That's a huge profit for a day trade!
I will start posting my BTC trades in this channel. If you want to follow my trade, just click my avatar and follow me to get notified when I post.
Do you recommend buying BTC now at $8500?
Looking at your chart... the price of BTC now is just above the support level.
JoeBiggs · 7 years agopermalink · reply (2)
@JoeBiggs: Yes. buy it. Just put a stop loss order below $8500... probably around 8250 which is previous low on that chart.
David · 7 years agopermalink · reply
@JoeBiggs: Right now, it looks like it's just bouncing off 8500 and heading back to 9000... we'll see if this continues.
permalink · reply