

 Dizkover
Today's #AAPL Breakout Could Hit $570 by December!
Updated December 8, 2013 ● 728 views
Fresh Stocks News, Tips, and Ideas!
The Stocks Channel goal is to help fellow stock traders on making a profit! This channel features stocks news, stocks trading ideas, and stocks tips from fellow Dizkover members. We are mostly traders by profession.
Dizkover Members Get The Tips First!
A lot of our members are also active at Stocktwits and Yahoo finance boards. But often, Dizkover members get the tips fist. So checkout out the Stocks Channel often for fresh stock trading tips!
Join Stocks Channel!
Stocks Channel is open for everyone. Whether you are a findamental or technical trader, you are welcome to share your own trading ideas and tips.
Common Hashtags:
- #StockIdeas - stock trading ideas supported by technical analysis or fundamentals
- #StockNews - stock market news
- #TradingStrategy - stock trading strategy and tips
- #long and #short - suggestion to go long or short
Terms Of Use:
Trade at your own risk! We are not responsible in the event of trading loss. Always use your own research and analysis before you trade. Any tips and recommendations you find at thie website can be wrong.
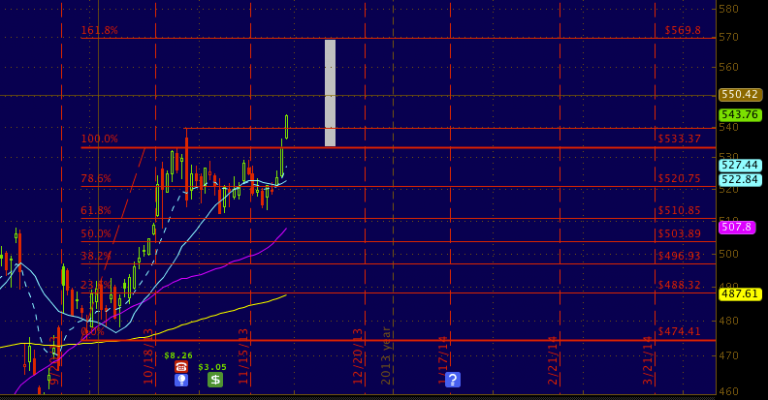
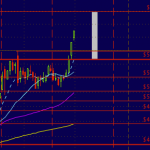
I've been watching AAPL in the past few days when it started to trade higher.
Looking at the above chart, the previous high was $540. A break above $540 could mean a possible run through the next 161.8% Fib level at $570.
Today, AAPL just had breakout and now trading just above $543.
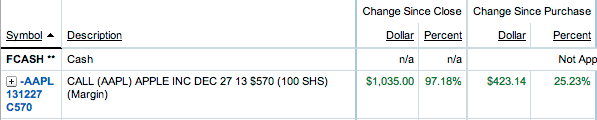
I just bought DEC27 $570 CALL this morning when it broke $540. Call is currently up 15%.
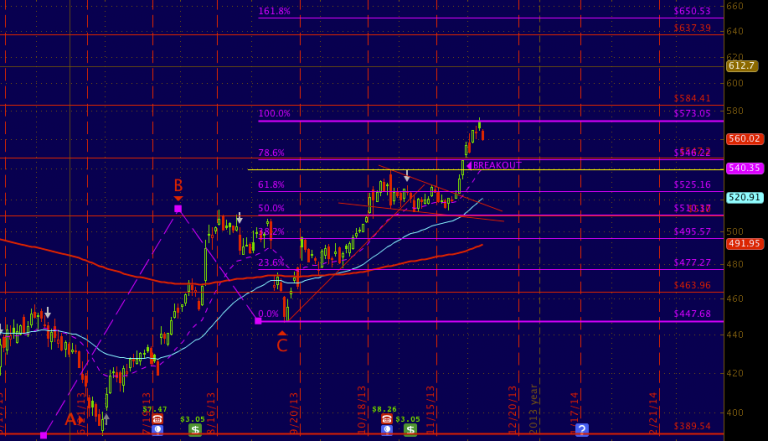
UPDATE 12/2: Posted a chart update below. I added more to my position. Call is now up 150%!
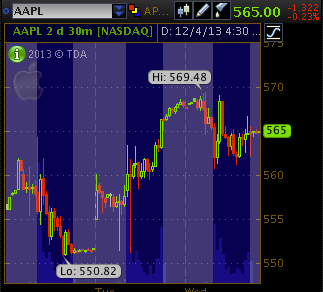
UPDATE 12/4: Reached $569 close to our target! Sold half of for 290% profit!
UPDATE 12/5: Reached $575!!! Sold all remaining position! See the 3rd chart on how the AAPL chart played out. Almost spot on!
Thank you!
I'm new to options and just learning. But I followed your tip and bought a small position. Thanks for your tip! My call is currently up 25% in just one day!
BullRun · 12 years agopermalink · reply (1)
@BullRun: Good job! The pre-market action today is really good... closing in to $550. I have 2 more tips that I will post here later today.
David · 12 years agopermalink · reply
UPDATE: Calls UP 115%
AAPL is on it's way to $570! You still can get on board!
David · 12 years agopermalink · reply (0)
AAPL currently trading close to 550 pre-market! Good tip man!
money101 · 12 years agopermalink · reply (0)
I've been waiting for this breakout. I took some loss last ER when AAPL failed to reach 540.
This resistance breakout is a pretty good indication that AAPL is heading for a bullish run! Thanks for sharing your chart.
stocksguru · 12 years agopermalink · reply (0)