

 Dizkover
#StockIdeas: #TSLA update... could target $160 with Fibonacci chart
Updated December 18, 2013 ● 892 views
Fresh Stocks News, Tips, and Ideas!
The Stocks Channel goal is to help fellow stock traders on making a profit! This channel features stocks news, stocks trading ideas, and stocks tips from fellow Dizkover members. We are mostly traders by profession.
Dizkover Members Get The Tips First!
A lot of our members are also active at Stocktwits and Yahoo finance boards. But often, Dizkover members get the tips fist. So checkout out the Stocks Channel often for fresh stock trading tips!
Join Stocks Channel!
Stocks Channel is open for everyone. Whether you are a findamental or technical trader, you are welcome to share your own trading ideas and tips.
Common Hashtags:
- #StockIdeas - stock trading ideas supported by technical analysis or fundamentals
- #StockNews - stock market news
- #TradingStrategy - stock trading strategy and tips
- #long and #short - suggestion to go long or short
Terms Of Use:
Trade at your own risk! We are not responsible in the event of trading loss. Always use your own research and analysis before you trade. Any tips and recommendations you find at thie website can be wrong.
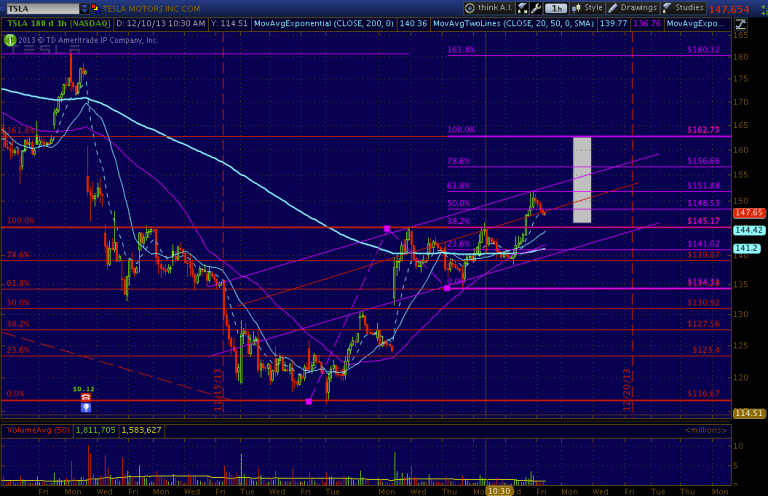
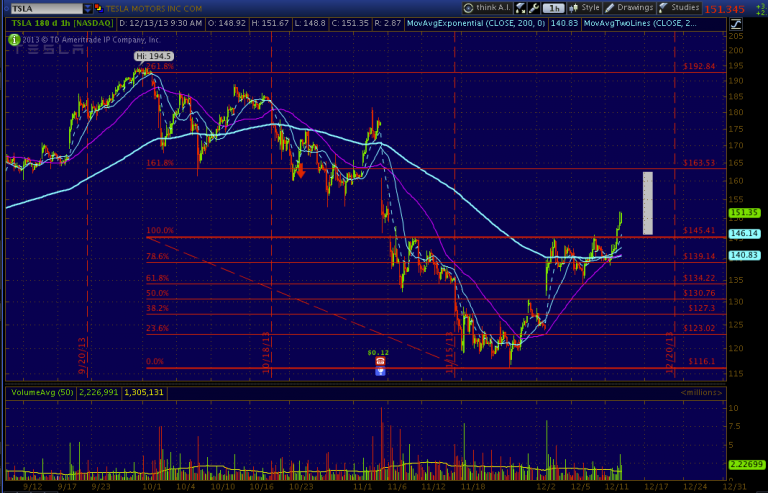
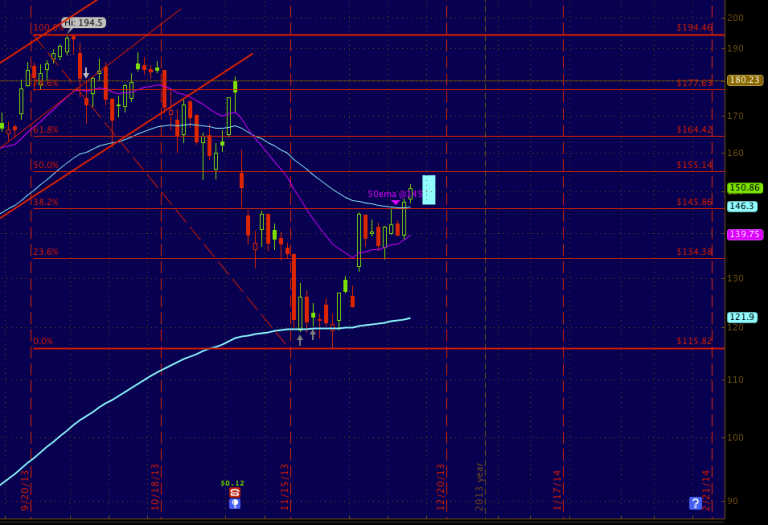
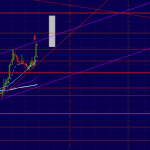
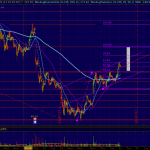
TSLA is ripping it today after it broke $145 resistance yesterday. This could hit the next Fib target above $160 area in next few days. Also notice the bullish cup and handle pattern. Daily chart shows $155 area could be first target.
This is the best swing trader chart. Right on the money of the Fibonacci retracements!
The pullback from 61.8% ($151.8) today could mean re-testing the $145 level next week. If that holds well and started to go higher and past 61.8%, $162 should be in the bag.
Have a good weekend!
DISCLOSURE: Bought calls yesterday. JAN10 150c and 155c
UPDATE 12/17: Closed all calls at $154 for 60% profit. Though $162 is target.. $154 is a heavy resistance line of uptrend channel which could pullback. It's best to take profits. Bought small puts for pullback to 50% Fib line.
UPDATE 12/18: Just like the chart prediction, pullback to 50%, trading at $147 now. Sold puts for 45% profit. No position.
Alert posted on TSLA:
Also Read:
- How To Trade Using Fibonacci Retracements | #FB #TSLA
- How To Trade With Fibonacci Extension? | #YHOO
Posted on stocktwits. Sold all calls yesterday when resistance is met.
admin · 12 years agopermalink · reply (0)
Beautiful technicals... next week will be a lot more interesting.
David · 12 years agopermalink · reply (4)
@David: Hi David, looking for good book to learn fibs trading, any suggetions plesase?
azbaliga · 12 years agopermalink · reply
@azbaliga: let me find the pdf book I downloaded in my iPad few years back...
David · 12 years agopermalink · reply
@David: how do I follow you on stocktwits?
azbaliga · 12 years agopermalink · reply
@azbaliga: this is me.... http://stocktwits.com/roceller
David · 12 years agopermalink · reply