

 Dizkover
#StockIdeas: #TSLA is getting really interesting today
Updated December 12, 2013 ● 1,546 views
Fresh Stocks News, Tips, and Ideas!
The Stocks Channel goal is to help fellow stock traders on making a profit! This channel features stocks news, stocks trading ideas, and stocks tips from fellow Dizkover members. We are mostly traders by profession.
Dizkover Members Get The Tips First!
A lot of our members are also active at Stocktwits and Yahoo finance boards. But often, Dizkover members get the tips fist. So checkout out the Stocks Channel often for fresh stock trading tips!
Join Stocks Channel!
Stocks Channel is open for everyone. Whether you are a findamental or technical trader, you are welcome to share your own trading ideas and tips.
Common Hashtags:
- #StockIdeas - stock trading ideas supported by technical analysis or fundamentals
- #StockNews - stock market news
- #TradingStrategy - stock trading strategy and tips
- #long and #short - suggestion to go long or short
Terms Of Use:
Trade at your own risk! We are not responsible in the event of trading loss. Always use your own research and analysis before you trade. Any tips and recommendations you find at thie website can be wrong.
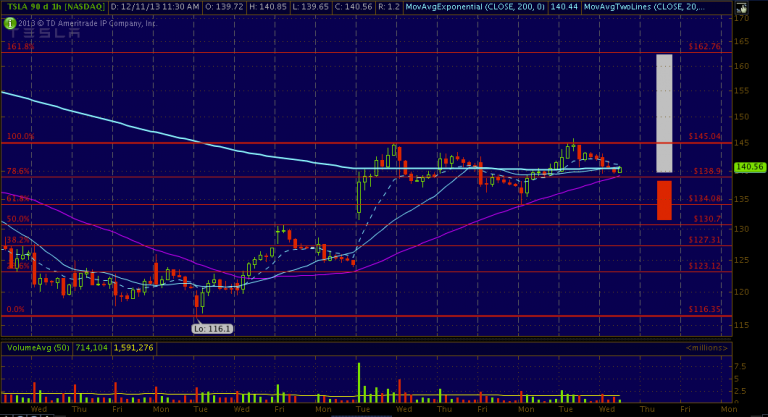
If you look at the the hourly chart of TSLA, all major moving averages are crossing in the hourly chart.
TSLA Price Action Scenario:
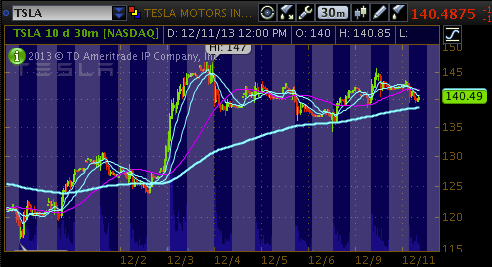
- Bullish: Breaking above $145 and shooting up to target above $160. How? if it starts breaking above 200ema (hourly) and bounce from 200ema in (30min).
- Bearish: Filling the gap down to $130. This will likely happen if it trades below $138.
How To trade TSLA?
Your safest bet here if you're bullish is entry when it breaks above $145. (around $146 area).
Remember, trade at your own risk. Always do your own research before trading.
DISCLOSURE:
UPDATE 12/12:
- Bought JAN150c @142 - I bought early when I noticed an aggressive morning bullish price action
- Bought extra JAN155c @146 - after it broke $145 resistance. Could target $160 soon.
Also Read:
- How To Trade Using Fibonacci Retracements | #FB #TSLA
- How To Trade With Fibonacci Extension? | #YHOO
Past Trading Performance:
$145 resistance clearly broken. $155 is ideal next target on the daily.
David · 12 years agopermalink · reply (2)
@David: Hi, is 90day 1hr data always good to get fibs right? learning a lot from reading your posts and charts.. thx
azbaliga · 12 years agopermalink · reply
@azbaliga: Thanks... Yes. I always look at the hourly chart first to plot the Fib levels. In most cases, it should be inline in what you will see on the daily too.
David · 12 years agopermalink · reply