

 Dizkover
#STUDY: Stocks Technical Analysis, How To Trade With Fibonacci Extension? | #YHOO
Updated December 11, 2013 ● 1,800 views
Fresh Stocks News, Tips, and Ideas!
The Stocks Channel goal is to help fellow stock traders on making a profit! This channel features stocks news, stocks trading ideas, and stocks tips from fellow Dizkover members. We are mostly traders by profession.
Dizkover Members Get The Tips First!
A lot of our members are also active at Stocktwits and Yahoo finance boards. But often, Dizkover members get the tips fist. So checkout out the Stocks Channel often for fresh stock trading tips!
Join Stocks Channel!
Stocks Channel is open for everyone. Whether you are a findamental or technical trader, you are welcome to share your own trading ideas and tips.
Common Hashtags:
- #StockIdeas - stock trading ideas supported by technical analysis or fundamentals
- #StockNews - stock market news
- #TradingStrategy - stock trading strategy and tips
- #long and #short - suggestion to go long or short
Terms Of Use:
Trade at your own risk! We are not responsible in the event of trading loss. Always use your own research and analysis before you trade. Any tips and recommendations you find at thie website can be wrong.
Fibonacci Retracements and Fibonacci Extensions are the two main charts I use on my stocks technical analysis.
Last week, I showed you how to trade using Fibonacci Retracements. I will show you this time how to trade using Fibonacci Extension using a live example of my trade with YHOO. Fibonacci Extension in theory, is the prediction of the future price of stock where traders usually buy or sell for profits.
The main price extension levels are 100%, 161.8%, and so on. The reason why you see stocks accurately rise or fall on those levels is due majority of traders looking at the same Fibonacci chart where they take action whether to buy or sell to take profits.
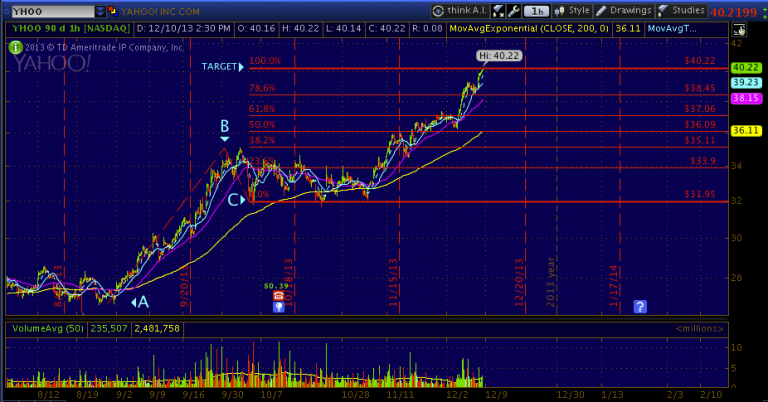
How I traded YHOO with a target of $40 using Fibonacci Extension:
When YHOO started to trade higher at $37 area on November 27, I looked at the chart and saw the possibility of reaching $40 using the Fibonacci Extension.
You have 3 points in Fibonacci Extension:
- A - previous low
- B - previous high
- C - support price level
If you look at the chart above you can see how I plotted A, B, and C. That plot will show you the Fibonacci Extension price levels where $40.22 just sits at 100%. And that was the target.
As you can see, YHOO reach $40.22 today and is actually trying to go higher.
Alert posted Nov. 27: Fibonacci says #YHOO could hit $40 soon
Also read: How To Trade Using Fibonacci Retracements | #FB #TSLA
Past trading performance:
This is a breautiful chart!
admin · 12 years agopermalink · reply (0)
Wow...! that's just right on the money!
JoeBiggs · 12 years agopermalink · reply (0)