

 Dizkover
#StockIdeas: Technical Analysis shows #AAPL could be heading to $590 in few weeks
Updated December 23, 2013 ● 743 views
Fresh Stocks News, Tips, and Ideas!
The Stocks Channel goal is to help fellow stock traders on making a profit! This channel features stocks news, stocks trading ideas, and stocks tips from fellow Dizkover members. We are mostly traders by profession.
Dizkover Members Get The Tips First!
A lot of our members are also active at Stocktwits and Yahoo finance boards. But often, Dizkover members get the tips fist. So checkout out the Stocks Channel often for fresh stock trading tips!
Join Stocks Channel!
Stocks Channel is open for everyone. Whether you are a findamental or technical trader, you are welcome to share your own trading ideas and tips.
Common Hashtags:
- #StockIdeas - stock trading ideas supported by technical analysis or fundamentals
- #StockNews - stock market news
- #TradingStrategy - stock trading strategy and tips
- #long and #short - suggestion to go long or short
Terms Of Use:
Trade at your own risk! We are not responsible in the event of trading loss. Always use your own research and analysis before you trade. Any tips and recommendations you find at thie website can be wrong.
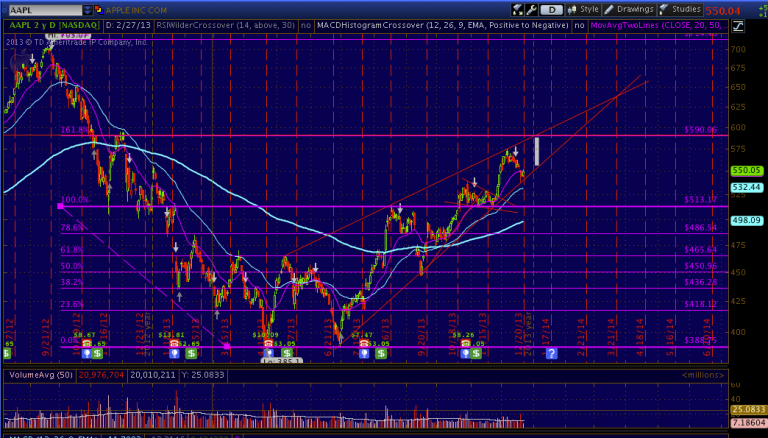
Apple (AAPL) has been battered in the past few weeks after it reached the $570 area. It pulled back as much as $540 last Thursday.
But looking at the daily chart gives me a reason to believe it could rebound and head for $590 in few weeks. Plotting Fibonacci retracements on the daily chart shows $590 could be the nearest tartget at 161.8% level.
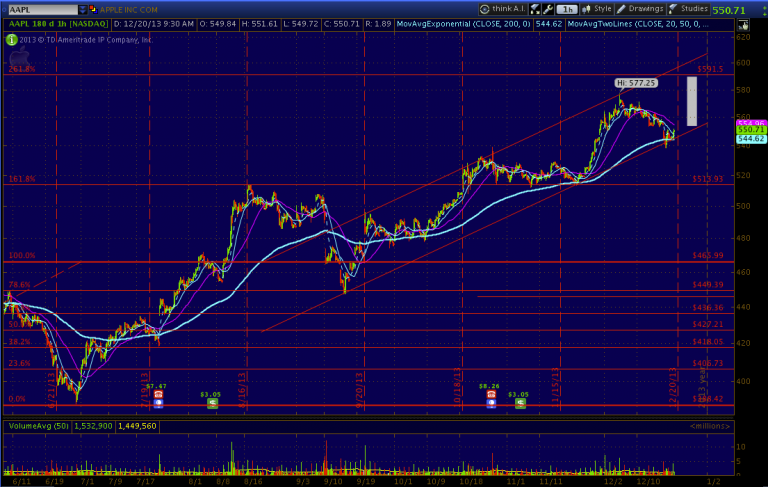
I see the same price target looking at the hourly chart. The hourly chart, also shows an uptrend channel formed with the current trading price of $550+ sitting at the lower support trendline. It's also just above the hourly 200ema line.
*Remember trade at your own risk. Always do your own research and analysis before you trade.
DISCLOSURE:
UPDATE 12/19: Bought JAN18 570C with stop below the hourly trendline support.
UPDATE 12/23: Holding calls. Up 73%.
Previous AAPL call:
Also Read:
- How To Trade Using Fibonacci Retracements | #FB #TSLA
- How To Trade With Fibonacci Extension? | #YHOO
up 73% on fridays call.
David · 12 years agopermalink · reply (0)
good call! AAPL up more than 3% today.
money101 · 12 years agopermalink · reply (0)